What is k6? #
k6 is an open-source tool for load testing and performance monitoring. It helps developers test the reliability of their applications by simulating real-world traffic. k6 is built with Go and scripting in JavaScript, k6 is lightweight and easy to use.
Why Use k6? #
- Scriptable with JavaScript: Write test scripts in an easy-to-understand format.
- Lightweight and Fast: Designed for high performance without unnecessary overhead.
- Built-in Metrics: Collect detailed statistics about your system’s performance.
- Integrations: Works with Grafana, InfluxDB, Prometheus, and other monitoring tools.
Installing k6 #
To get started, install k6 for your operating system using k6 installation instructions.
Writing Your First k6 Test #
Let’s create a simple script to load test a website.
Example: Basic Load Test #
Create a file called script.js and add the following code:
import http from 'k6/http';
import { sleep } from 'k6';

export let options = {
  vus: 10, // 10 virtual users
  duration: '10s', // test runs for 10 seconds
};

export default function () {
  http.get('http://localhost:1313');
  sleep(1);
}
Our test script will be issuing HTTP GET requests to http://localhost:1313 which is a Hugo web server running locally. If you have followed along in my previous post, you’ll be able to use the same target (but make sure you run hugo server -D to start your Hugo server while running the k6 test):
https://quickpizza.grafana.com as the target in script.js
Running the Test #
Run the test in your terminal:
k6 run script.js
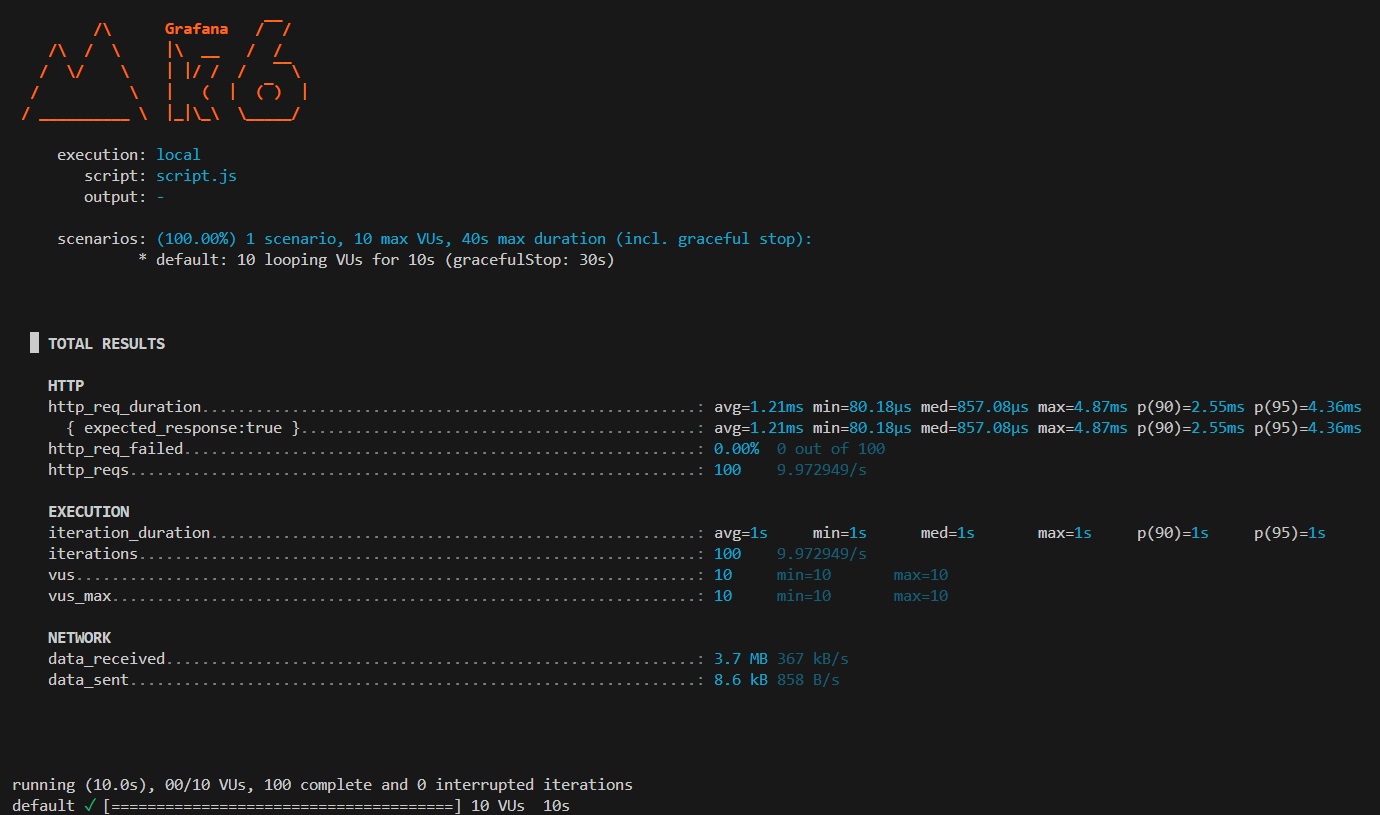
Example Output: #

The end-of-test summary output includes:
- request response times
- request counts
- error rates
- network info
Advanced Usage #
1. Simulating Different Load Scenarios #
Use options.stages property to simulate real-world traffic spikes:
export let options = {
  stages: [
    { duration: '10s', target: 20 }, // Ramp up to 20 users
    { duration: '30s', target: 50 }, // Stay at 50 users
    { duration: '10s', target: 0 },  // Ramp down to 0
  ],
};
2. POST Data to an API #
Send a HTTP POST request with a JSON payload:
import http from 'k6/http';

export default function () {
  let url = 'http://localhost:1313/users';
  let payload = JSON.stringify({ user: 'John', age: 30, city: 'New York' });
  let params = { headers: { 'Content-Type': 'application/json' } };

  http.post(url, payload, params);
}
3. Integrating with Grafana and InfluxDB #
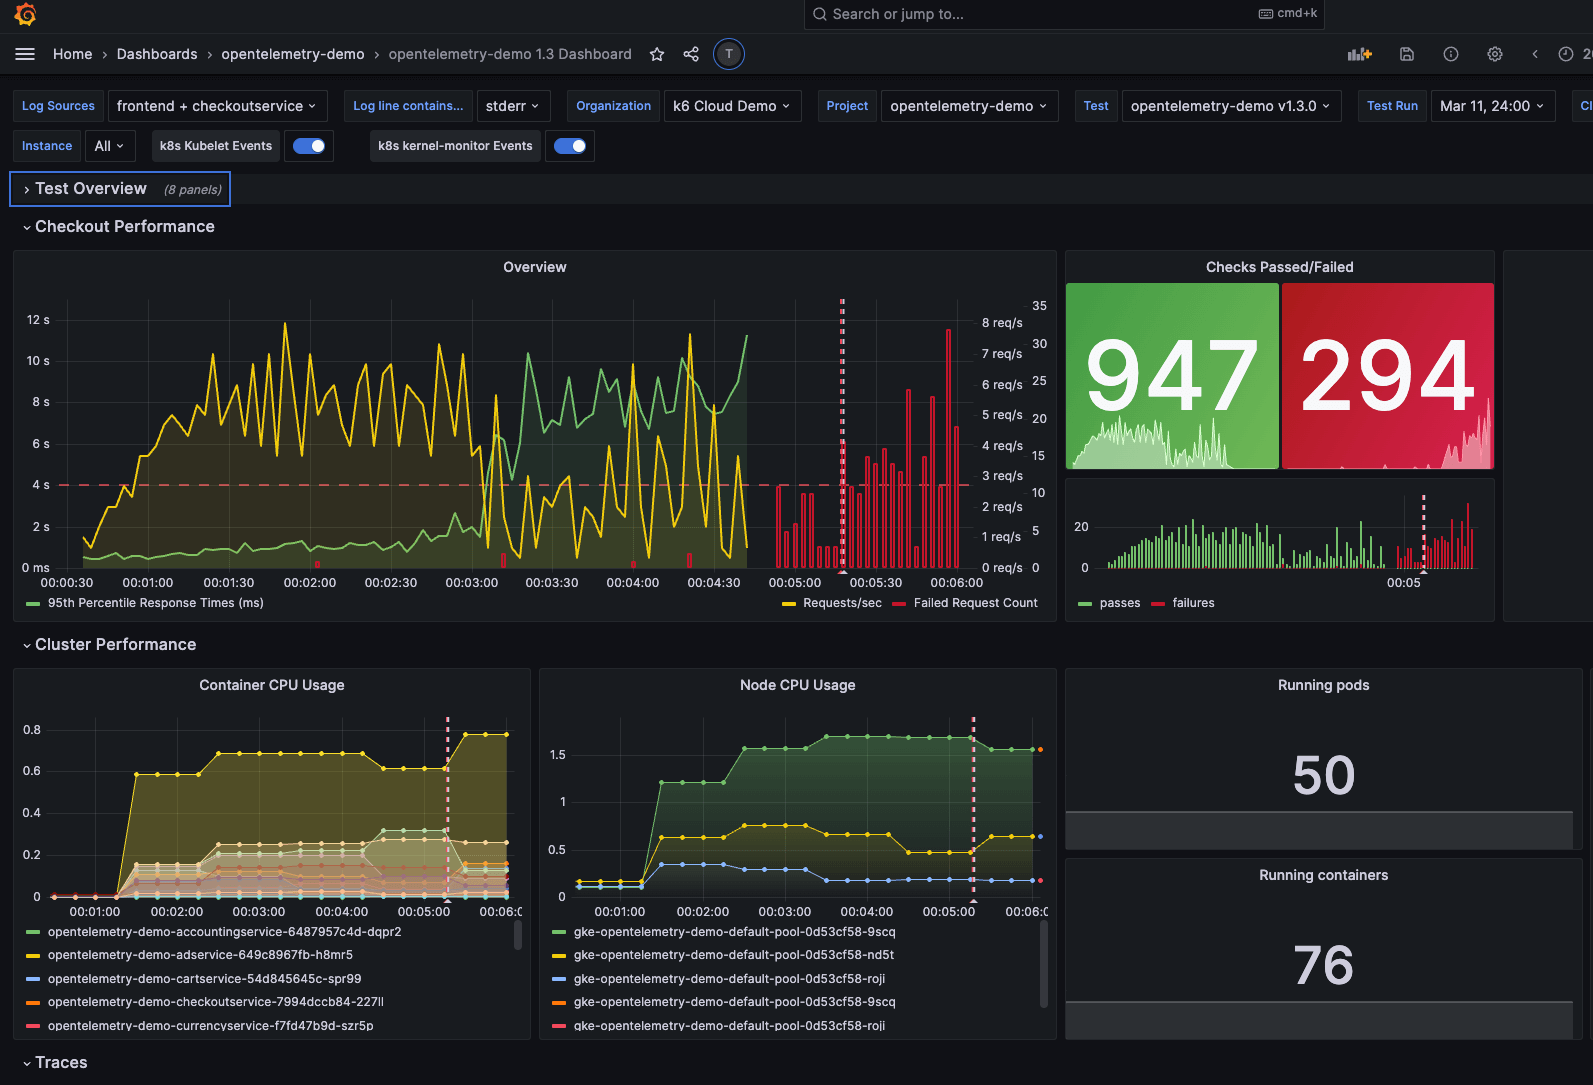
k6 supports real-time monitoring using Grafana and InfluxDB. You can visualize test results by setting up an InfluxDB backend and configuring k6 to send metrics:
k6 run --out influxdb=http://localhost:8086/myk6db script.js

Conclusion #
k6 is a powerful tool for load testing APIs and web applications. Its simplicity, performance, and integrations make it a great choice for developers and DevOps engineers.
Next Steps #
- Explore the k6 Documentation
- Try running a test with more virtual users
- Set up real-time monitoring with Grafana

